

Xuanyuan is an internal sales merchant platform under Alibaba’s food delivery business line.
This project focused on digitalizing the data drill-down workflow for enterprise sales teams managing top-tier merchants. Previously, sales relied heavily on offline Excel sheets to analyze operational data and identify problem stores. The process was inefficient, time-consuming, and difficult to standardize. We aimed to build a data-driven dashboard that streamlined issue detection, prioritized tasks, and improved sales efficiency in merchant management.
Role
Duration
4 Weeks
Tools
Figma
Sketch
Skills
UX/UI Design
Data Analysis
Content Design
Team
1 Product Manager
1 Software Engineer
1 Data Scientist
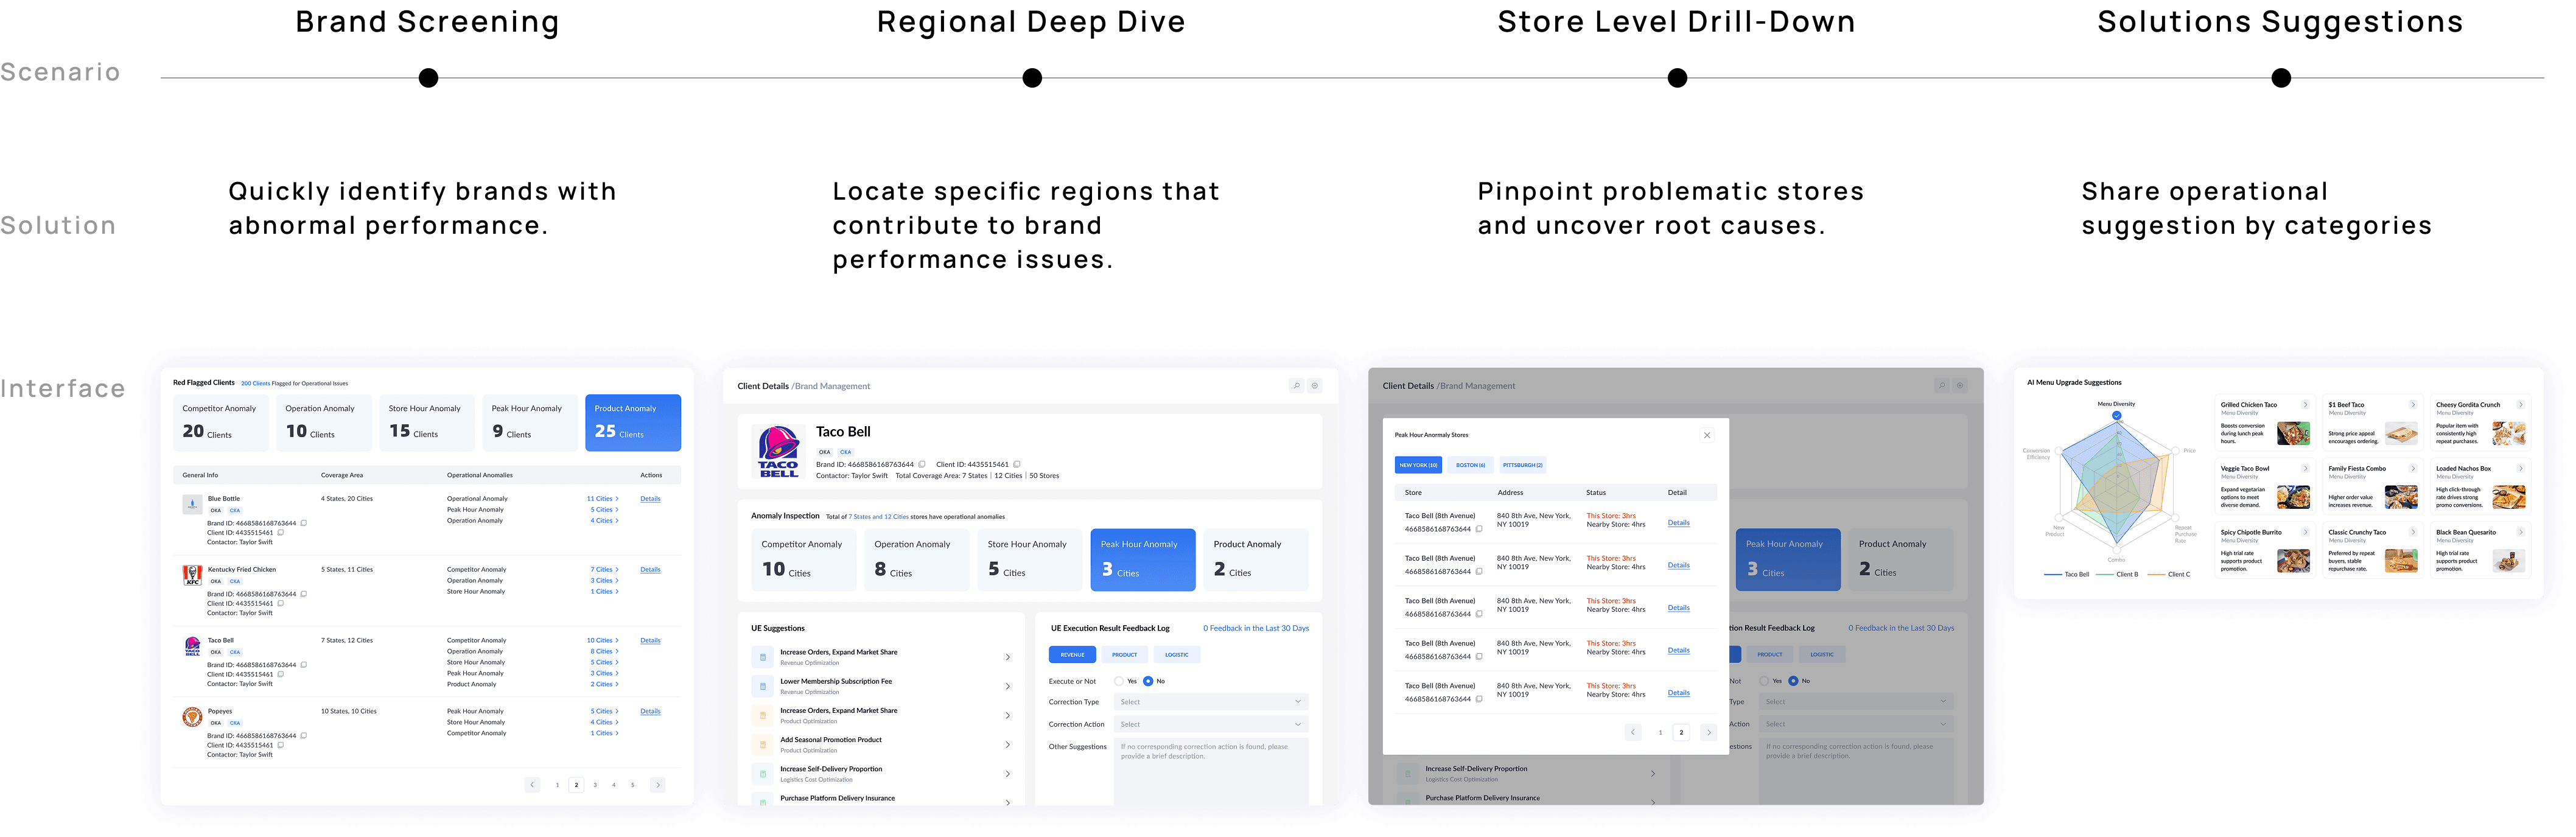
Brand Performance Monitoring Dashboard
Enables sales teams to navigate from brand-level overviews to city and store details, identifying operational anomalies with precision.


Real-time monitoring surfaces abnormal patterns and triggers early warnings, helping sales prioritize intervention and maintain brand health at scale.
Enterprise sales teams often manage multiple brands simultaneously, each covering extensive regions, sometimes nationwide with hundreds of stores. Relying on fragmented offline spreadsheets to monitor brand performance makes it difficult to detect issues promptly. The lack of a centralized, real-time system leads to inefficient decision-making, delayed problem-solving, and increased workload for sales teams.
How might we help sales efficiently monitor and prioritize brand issues across regions and stores through a streamlined, data-driven dashboard?
Research Process
Understand the Role Differences
We started by analyzing the sales operation structure. Enterprise sales managers are responsible for multiple brands and regions, often covering hundreds or even thousands of stores. They need to balance nationwide strategies with regional execution, which requires a robust system for quickly locating underperforming stores and diagnosing issues at scale.

Key Insights 01 :
Enterprise sales challenges lie beneath the surface and require deep data diagnosis.
User Interviews
We interviewed 10+ both junior and senior enterprise sales managers who manage both national and regional accounts. A recurring theme was their heavy reliance on Excel spreadsheets to manually filter data by region, store, and time, which often took hours to identify problems and prioritize action plans.

Key Insights 02 :
Enterprise sales focus on regional performance, relying on comprehensive data analysis instead of single-store issues.
User Journey
To understand the current workflow of enterprise sales during data diagnosis, we mapped out the entire process from identifying brand issues to proposing solutions and aligning with clients.

Key Insights 03 :
Sales rely heavily on manual data checks, which slows down problem identification and reduces efficiency.

UX VISION
Empower enterprise sales with accurate, efficient, and actionable data insights.
FINAL DESIGN SOLUTIONS
The Enterprise Sales Diagnosis Tool delivers a progressive and streamlined problem-solving experience based on 4 key workflow stages, helping sales teams efficiently identify issues, drill down data, and align solutions with clients.
What We designed
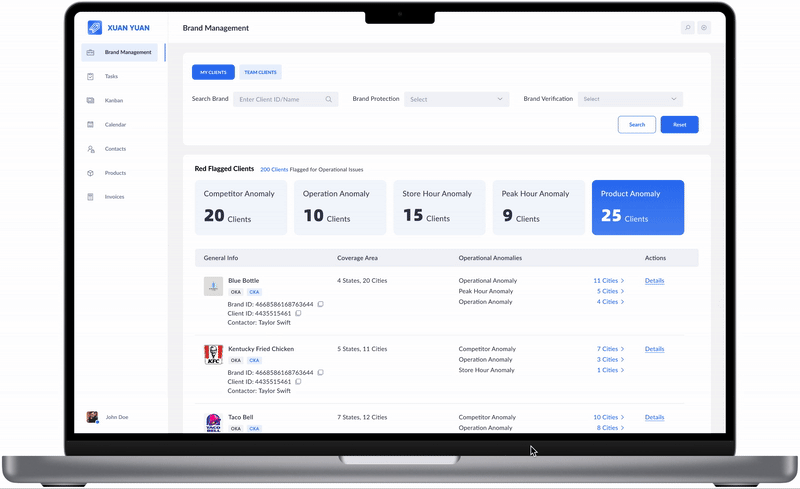
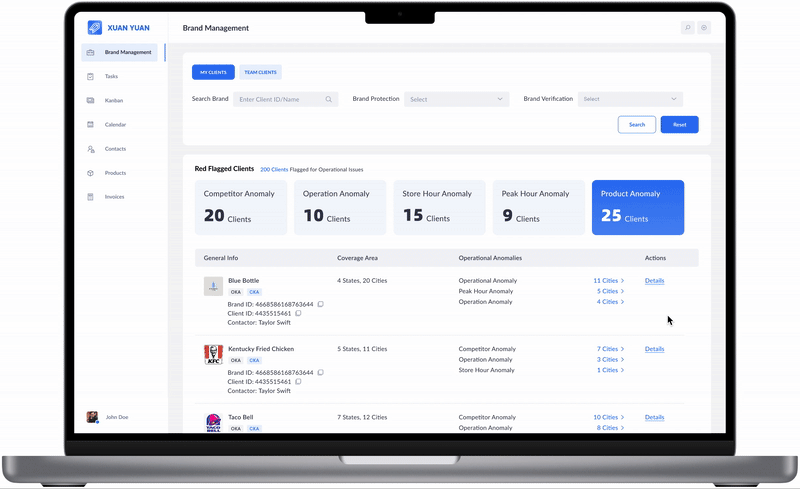
A top-level Clients Overview Dashboard, displaying each sales' full client list with pre-categorized issues and real-time key indicators.
Design Impact
Saves time on initial diagnosis and prevents sales from missing critical problems.
What We designed:
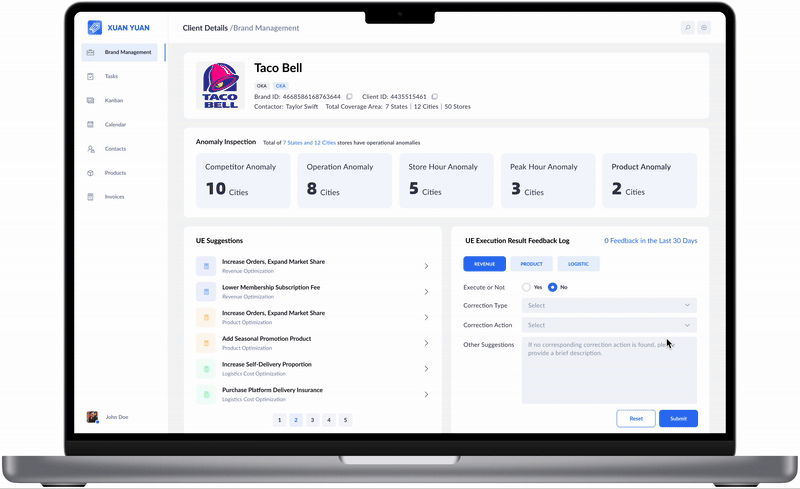
The client details page allows drill-down based on the brand's business structure, whether by city or state, ultimately reaching individual store-level insights.
Design Impact:
Enables focused issue identification for each brand client without navigating complex spreadsheets, significantly improving data retrieval efficiency.
What We designed
The product also offers multi-dimensional data analysis and solution recommendations. Features include benchmarking against similar merchants, menu optimization suggestions etc.
Design Impact
Helps sales deliver data-backed, targeted recommendations to clients, reducing decision-making time.
Leverage UX to Simplify Complex Data Workflows
Designing for enterprise sales data taught me how to structure complex information into intuitive workflows. By breaking down multi-layered data and surfacing key insights at the right moments, I was able to streamline decision-making and improve efficiency for users handling regional sales diagnostics.
AI Will Reshape Data Analysis
Reflecting on this project, I realized many tasks we designed for manual exploration could now be enhanced by AI-driven systems. AI agents are powerful tools to support data diagnosis by offering real-time insights, reducing manual effort, and enabling more adaptive decision-making in complex workflows.
Componentize Data Drill-Down for Scalable Dashboards
This project emphasized the importance of modular design in complex dashboards. By componentizing the data drill-down flow, we created flexible and reusable structures that can be easily adapted for different brands, metrics, and future business scenarios.